
There’s nothing like Salesforce to build lasting relationships with your customers. The best part is that as you build relationships, Salesforce reporting gathers data about your customers, their challenges, and their needs and expectations.
However, data on its own doesn’t mean much. Before you can gather insights from your Salesforce data, you’ll need to analyze it. Now, Salesforce wouldn’t be Salesforce if it didn’t help. The best CRM for sales teams has robust tools that allow you to create in-depth reports based on your customers’ data, giving you a complete view of your accounts.
This quick-start guide will show you how to use Salesforce reports and customize them to your needs.
What is a Salesforce Report?
Fundamentally, a Salesforce report is a report like any other. It gives you access to your Salesforce data in graphical or tabular, easy-to-understand formats. Instead of crunching numbers in your Google Sheets or Excel, Salesforce analyzes the data. It displays it visually, so you get deeper insights into your business in half the time.
Salesforce reports also allow you to share insights with other teams across your business. For example, you can analyze the entire lead journey, from MQL to conversion, enabling you to work better with other teams that drive revenue.
Salesforce Report Types
Firstly, Salesforce offers several built-in report types. These standard reports are templates that contain defined fields and data and are grouped into various categories.
Some of these categories include:
- Accounts and Contacts
- Administrative Reports
- Campaigns
- Contracts and Orders
- Forecasts
- Opportunities
- Leads
In addition to these standard reports, Salesforce also offers a custom report type that allows you to customize reports based on your unique needs and requirements. If the standard reports don’t provide the properties you need (e.g., customer lifetime value), custom properties will do the trick!
Salesforce Reporting Formats
In addition to different report types, Salesforce also offers different report formats. You can choose from four distinct formats: Summary, Tabular, Matrix, and Joined Reports.
Tabular Reports
Tabular reports are the simplest and quickest way to examine your data.
They contain data in organized columns, each with a matching row, much like a typical spreadsheet. And because they’re similar to spreadsheets, they’re ideal for users who like to create lists of records or lists with a single total.
The major disadvantage of tabular reports is that you can’t create groups of data or charts, and you can’t use them in dashboards.
Summary Reports in Salesforce Reporting
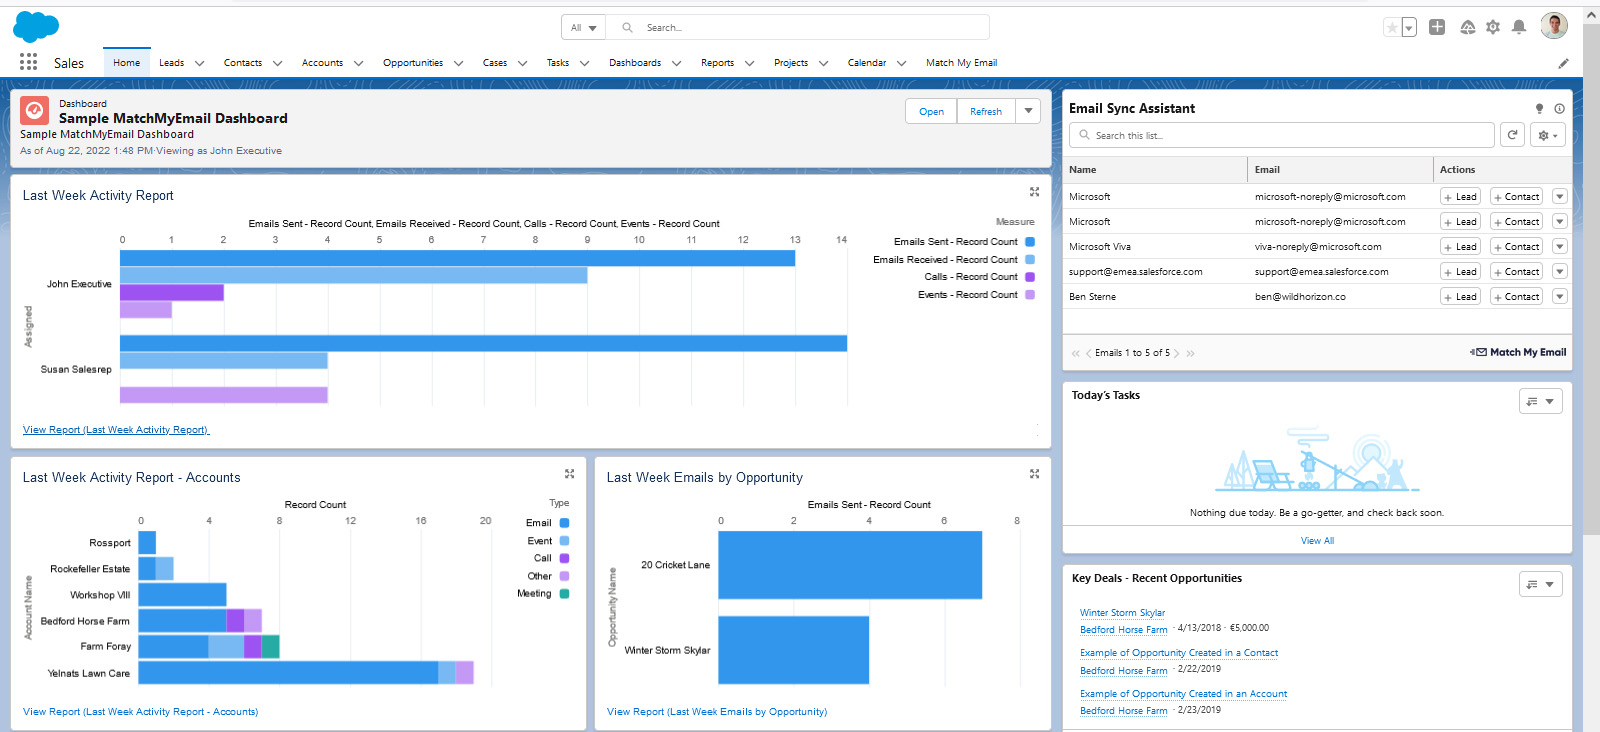
Summary reports are like tabular reports and, as such, allow you to examine your data in organized columns. However, the difference with summary reports is that they allow you to group rows of data, view subtotals, and create charts.
You can also use summary reports as a source for dashboard components. You’ll likely also use these reports if you want a report that shows you the subtotals based on the values for a particular field or when you want to create hierarchical lists.
The most straightforward example of summary reporting in Salesforce is revenue. For example, you can summarize the revenue won in a specific quarter and then share it with your team.
Matrix Reports
Matrix reports are similar to summary reports, but with the added benefit that they allow you to group data by both columns and rows.
Like summary reports, you can use them as a source for dashboard components.
You’ll use matrix reports when you want to compare related totals, especially if you’re working with large amounts of data and want to compare the values for different fields. They’re also helpful when looking at data by date, person, product, or geography.
For example, you could extract insights about product sales by geographical area, industry, etc.
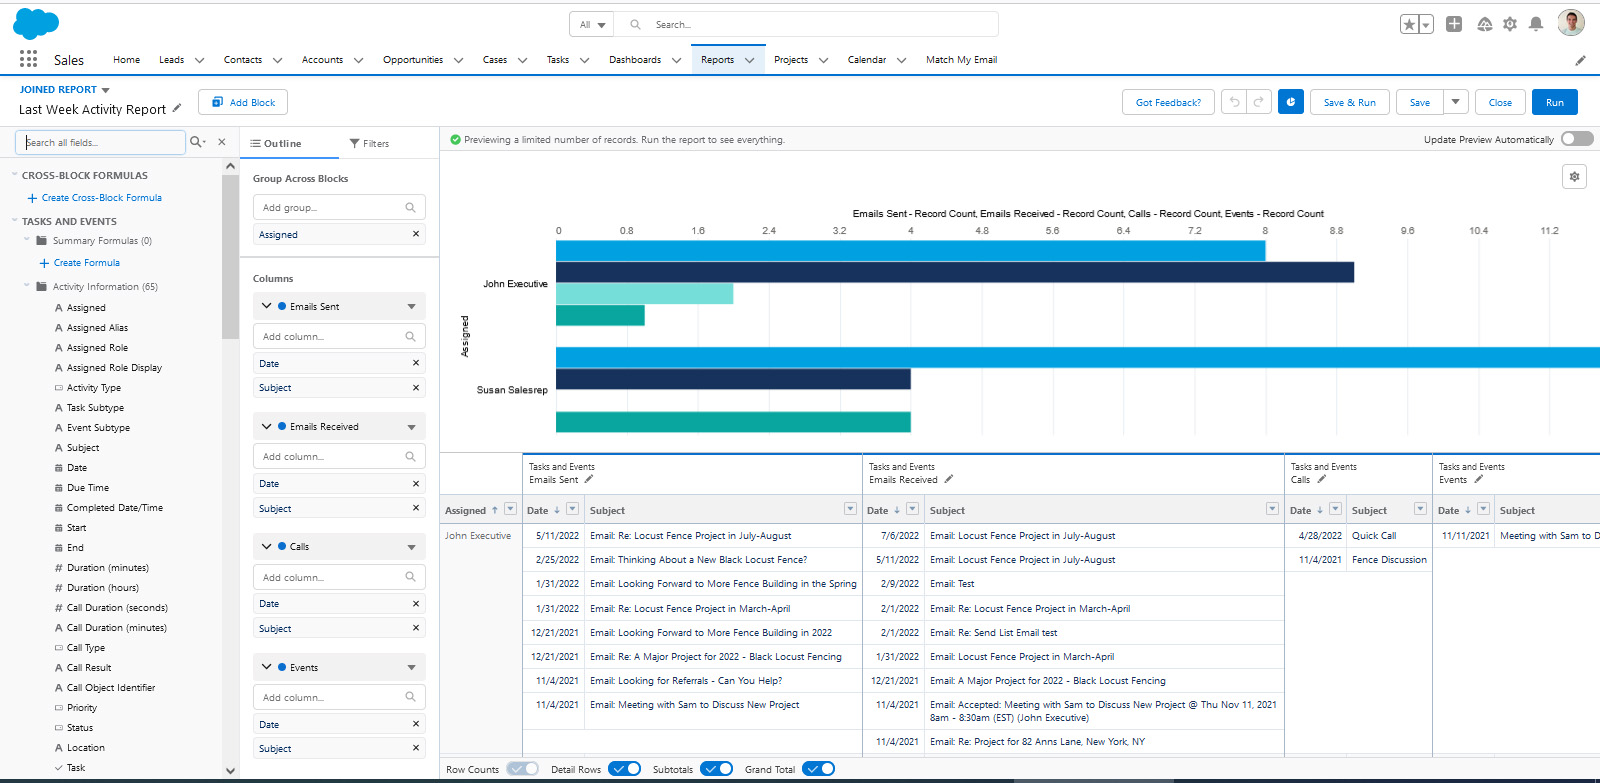
Joined Reports
You can combine multiple report blocks with joined reports that give you different data views. When you do this, every block acts like a sub-report with its fields, columns, filtering, and sorting.
For example, joined reports allow you to create an opportunity pipeline forecast based on different criteria.
Joined reports can even contain data from other report types. Keep in mind, however, that joined reports are only available if you use the Enterprise, Performance, Unlimited, and Developer additions of Salesforce.
Quick-Start: How to Create Reports With Salesforce Report Builder
Step 1: Create a New Salesforce Report
The first step is creating a new report by clicking the Reports tab on the tab bar and clicking the New Report button. If you don’t see the Reports tab on the tab bar, click on + and scroll down to find it.
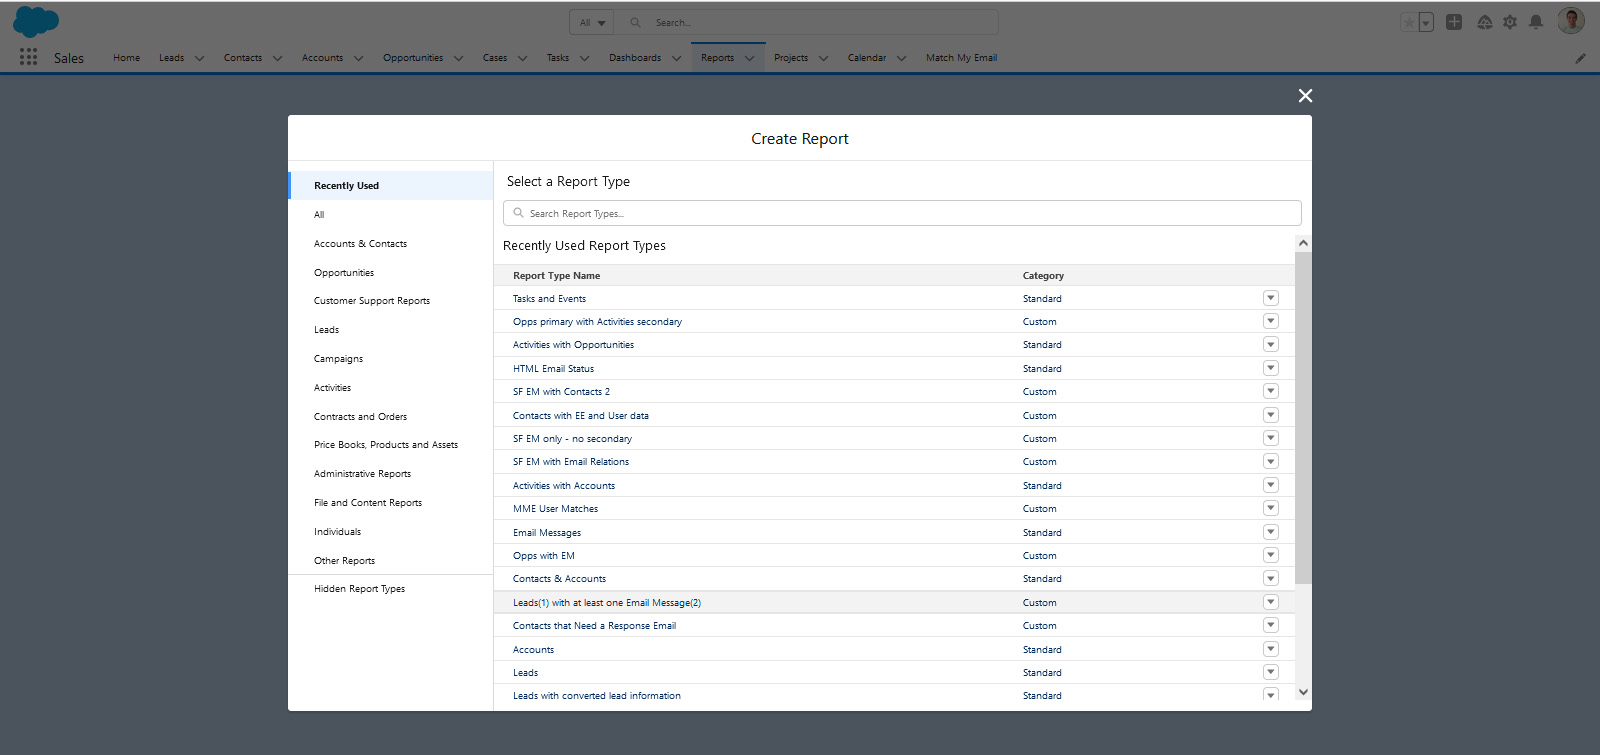
Step 2: Choose a Report Type
Once you’ve clicked on New Report, you can choose the report type you want. Here, you’ll select one of the report types we mentioned above by picking a category and then one of the available reports. When you’ve selected the report you need, click Create.
Step 3: Choose a Report Format
Once you’ve clicked Create, the report editor will open and show you a draft of your report. You’ll then be able to choose your report’s format by choosing one of the formats mentioned earlier in the Preview tab bar. When you’ve selected the format you would like, you can click Run Report.
Step 4: Customize the Report
You’ll then be able to customize your report by clicking Customize. Here, you can add fields to your report, change the view and timeframe, add filters, and more.
How to Create Reports in Salesforce Lightning
Lightning is a much more robust tool than the Classic Report Builder and gives you deeper insights into your data. With Salesforce Lightning reports, you can save the report by clicking Save As, exporting the report by clicking Printable View, or exporting the raw data using Export Details.
Step 1: Create a New Report in Salesforce Lightning Reporting
As mentioned above, the first step is to create a new report. When using Lightning, you’ll do this by going to the Reports tab in your dashboard’s horizontal navigation and clicking the New Report button.
Step 2: Choose a Report Type
Once you’ve clicked the New Report button, you’ll be able to choose one of the standard report types. Select one of the report types on the left. Then, choose the specific report type on the right.
Remember that once you choose a specific report type, you can’t change it in the future. Once you’re happy with your chosen report type, you can click on Continue.
Step 3: Configuration
Once you create the report, the report editor will show you a draft of your report. Here, you can configure the report based on your specific requirements. You’ll be able to add, remove, or edit filters, add or remove groups of data and columns, swap rows and columns, or add charts.
Step 4: Run Your Report
When you’re done customizing the report, click on Run. You also have the option to click Save to save your report while working on it or click Save & Run to save the report before running it. You can also edit and export the report.
Creating a Custom Salesforce Report
Finally, if the standard reports don’t meet your requirements, you’ll need to build a custom report. As an example, you could create a report that would show Contacts and Email communication.
In this walkthrough, we’ll use Salesforce Lightning to create a custom report. However, the process isn’t too different from the Salesforce Classic reporting.
Step 1: Create a Custom Report
To create a custom report, you’ll go to your Salesforce Setup page and enter “report types” in the quick find box. You’ll then click on the Report Types suggestion and Continue on the Custom Report Types page.
Step 2: Configure the Custom Report
You’ll then click on New Custom Report Type to define your custom report. First, define the primary object or the data that will be the focus of your report. Then, name the report type, add a description, and select a category. Also, you’ll specify the status of the report type and then click Next to go to the next step.
During the next step, you’ll define other objects that are related to the primary object of your custom report type.
Step 3: Save the Report
Once you’ve configured the report based on your specific requirements, you can click Save to view the information for your custom report type.
A Note on Custom Salesforce Properties
Since Salesforce doesn’t offer every property under the blue sky (but it might soon), you may have to configure additional properties.
For example, you can sync your product usage data with your Salesforce to instantly understand how leads who come through a specific channel use your product. Similarly, you could identify the best upselling opportunities.
Salesforce Reporting: The Fastest Way to Get Strategic Insights
If you want to rally your entire team around delighting your customers, there’s nothing like Salesforce reporting to help you. Now that you know how to create standard and custom reports, the Salesforce dashboard is your oyster!


